
Planting notes
- The 2023 USDA map uses 1991-2020 data from 13,412 weather stations, compared with 7,983 for the 2012 map.
- Zones are 10-degree Fahrenheit bands of the average annual extreme minimum temperature, split into 5-degree half zones “a” and “b.”
- About half the country shifted to the next warmer half zone in 2023; USDA says that does not mean you should remove plants that are thriving.
Every plant tag and catalog lists a hardiness zone. It is the single most useful number for choosing perennials, shrubs and trees that will survive your winters. It is also widely misunderstood.
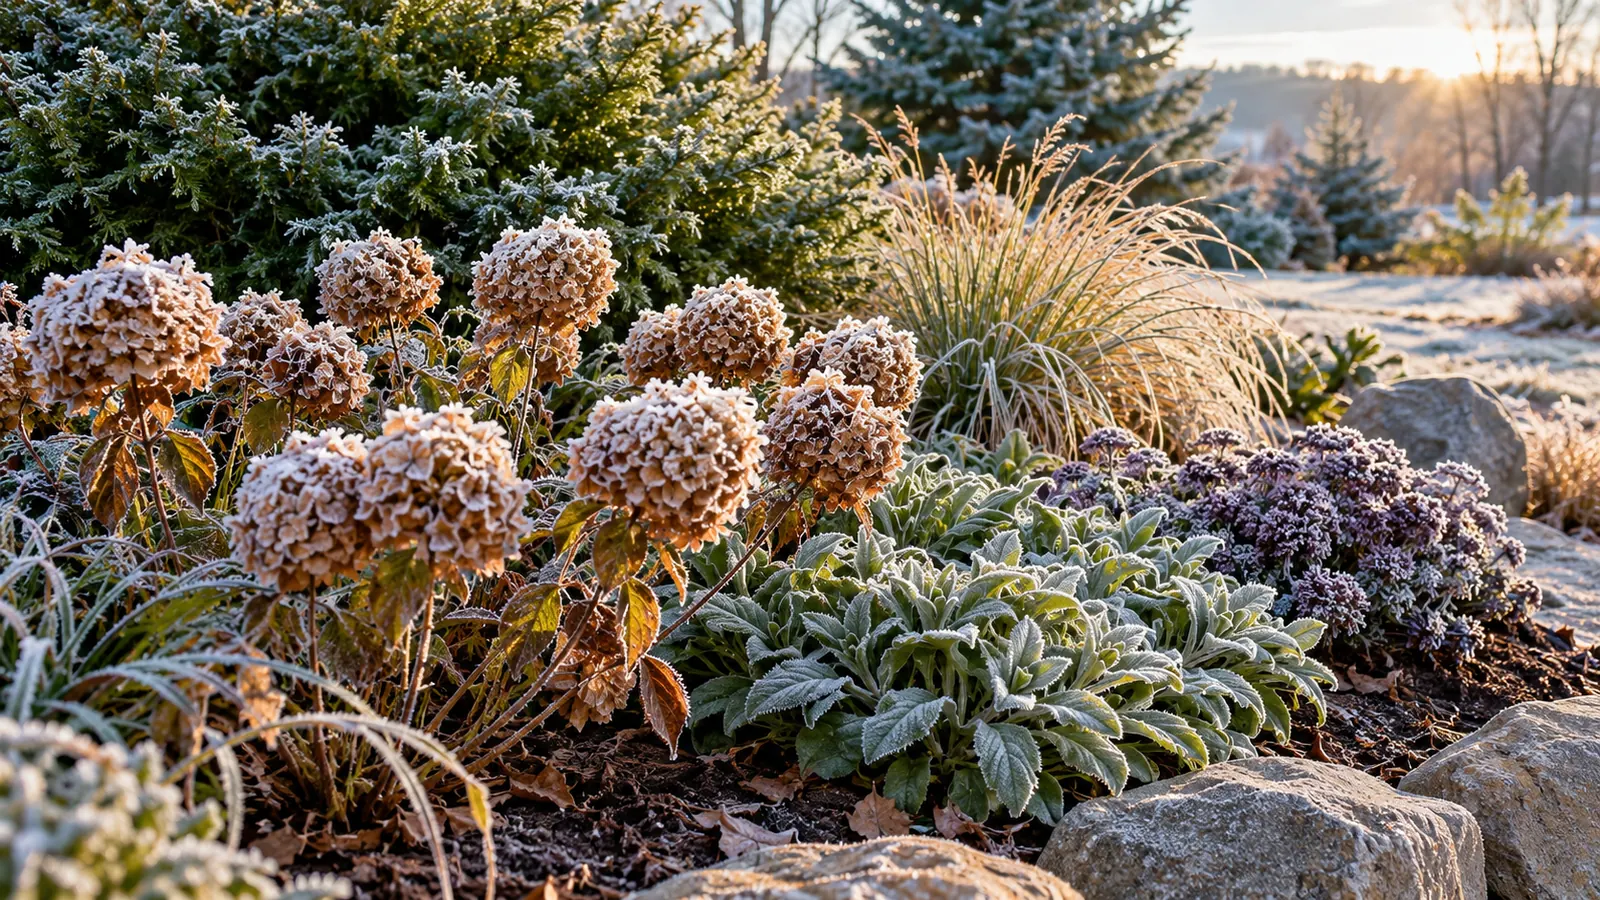
What the map measures
The U.S. Department of Agriculture’s Plant Hardiness Zone Map is, in USDA’s words, the standard by which gardeners and growers can determine which perennial plants are most likely to thrive at a location. It is based on one number: the average annual extreme minimum winter temperature. That is the average of the coldest night of each year over a 30-year period, not the coldest temperature ever recorded.
| Feature | 2023 map |
|---|---|
| What it is based on | Average annual extreme minimum winter temperature |
| Years of data | 1991 to 2020 |
| Weather stations used | 13,412 (the 2012 map used 7,983) |
| Zones | 13, from zone 1 (coldest) to zone 13 (warmest) |
| Size of each zone | 10 degrees Fahrenheit |
| Half zones | “a” and “b,” each 5 degrees Fahrenheit, for example 7a and 7b |
| Developed by | USDA Agricultural Research Service and Oregon State University’s PRISM Climate Group |
The map covers the continental United States, Alaska, Hawaii and Puerto Rico. USDA released it on November 15, 2023, the first update since 2012.
How to find your zone
Go to the map at planthardiness.ars.usda.gov and enter your ZIP code, or click your location on the interactive map. You can also download and print national, regional or state maps; USDA does not print paper copies of this edition for the public.
Why your zone may have changed
Compared with the 2012 map, USDA says about half of the country shifted to the next warmer half zone and the other half stayed the same. A shift means an area warmed by somewhere between 0 and 5 degrees Fahrenheit in its average coldest night. Most of the changes come from using more recent data and more weather stations, plus better mapping methods.
USDA is careful about what that means. The map developers caution against treating zone changes as reliable indicators of global climate change, because the coldest night of the year varies so much from year to year and because the mapping methods changed.
Tip: If your zone changed, USDA’s advice is not to start removing plants. What has thrived in your yard will most likely continue to thrive.
What a zone does not tell you
USDA itself lists many factors besides winter cold that decide whether a plant survives:
- Light: plants at the edge of their hardiness can be injured by too much winter sun as well as too little light in summer.
- Soil moisture: a plant that goes into winter dormancy stressed by dry autumn soil may be injured even if it is hardy in your zone.
- Temperature: plants have optimal ranges for both cold and heat.
- Wind, soil type, humidity, pollution and snow cover all play a part.
- USDA singles out warm-season heat and moisture balance as particularly important; the hardiness map does not measure summer heat.
Microclimates in your own yard
USDA notes that microclimates, small-scale variations in climate, can make part of a yard warmer or colder than the map suggests. Blacktop and concrete create small heat islands; low spots can be frost pockets. A south-facing wall may let you grow something half a zone tender, while a hollow at the bottom of a slope may need tougher plants. Mark these on your plan; see How to Draw a Landscape Plan for Your Yard, Step by Step.
Planting at the edge
Plants rated exactly at your zone’s limit are a gamble. USDA points out that a rare cold snap lasting a day or two can kill plants that have thrived for several years. For trees and expensive shrubs, many gardeners choose plants rated at least one zone colder than their own.
Zones across the regions
To give a sense of how different winters are across the country, here are the average January low temperatures at a few airports from NOAA’s 1991-2020 climate normals. These are average lows, not the extreme minimums the zone map uses, but they show the spread:
| City | Average January low |
|---|---|
| Denver | 18.7°F |
| Chicago | 18.8°F |
| Boston | 23.1°F |
| Atlanta | 35.6°F |
| Seattle | 37.7°F |
| Miami | 61.0°F |
Our regional guides, starting with Landscaping in the Midwest: Prairie Plants, Rain Gardens and Cold Winters and Landscaping in Florida and on the Gulf Coast, go into each climate in more detail.
The bottom line
Look up your zone by ZIP code, choose perennials, shrubs and trees rated for it, and leave a margin for the expensive ones. Then look past the zone at sun, soil, moisture, wind and summer heat. The zone gets plants through winter; the rest of the plan gets them through the year.